

1. Independence (if any) between variables
2. Whether various subgroups are homogeneous --use difference between observed rather than O-E
3. Whether there is a significant difference in proportions in the subclasses among subgroups.
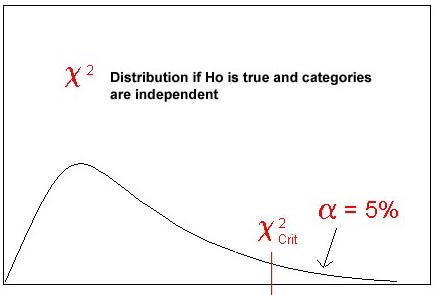 Chi2
analysis requires calculation of the expected numbers in each category,
followed by a comparison with what was actually observed. We do this by
calculating an observed - expected component for each cell in the cross-categorization.
The Chi2 value is the total of all these values for all cells
in the contingency table.
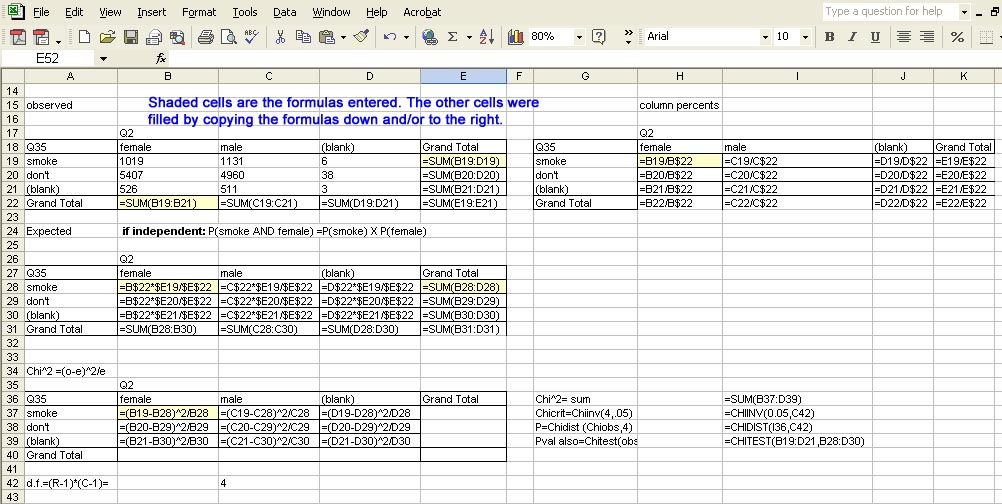
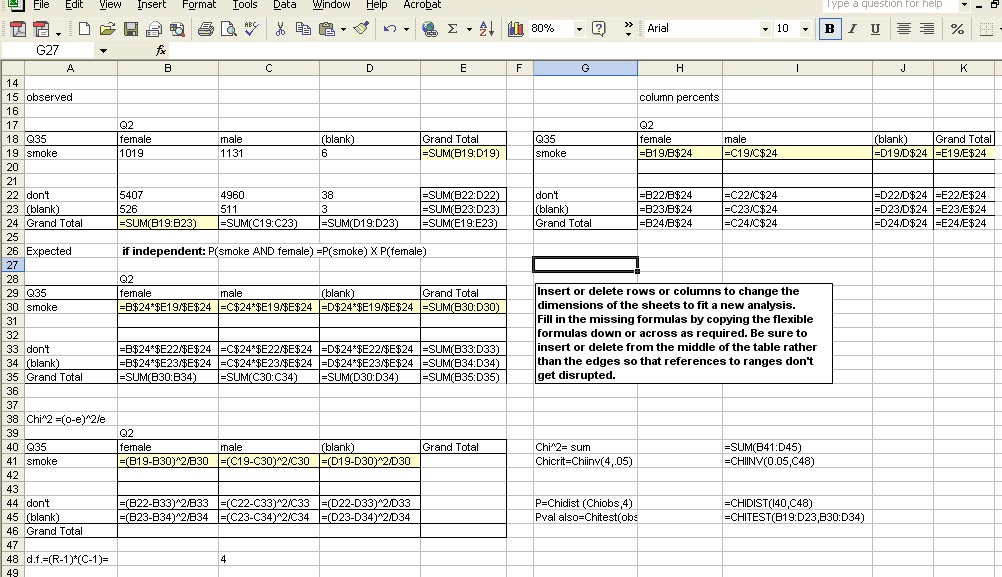
As a first example, here is the crosstabulation of gender (Q2) and smoking
(Q35) from the YRBS 2001. The formulas are designed so that they can be
entered once, then copied down or across to give the right result in all
cells. Formulas entered are shown in the shaded cells. The first
table shows actual, or observed, counts. The table of percents is designed
to calculate as percent of column totals. In some cases, it would be better
to calculate as percent of column totals. The table of expected values
is calculated assuming that gender and smoking are independent (Ho:) In
that case, the ratio of smokers to nonsmokers should be the same regardless
of gender. The probability of being both female and a smoker would be the
product of P(female) X P(smoke).
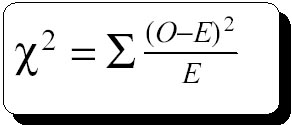
The Chi2 Statistic is calculated by comparing observed
to expected for each combination in the table. The Chi2 statistic
is the sum over all cells in the table.
Chi2 Critical is obtained through the ChiInv Function for
alpha and degrees of freedom. d.f. = Rows-1 X Columns-1. In this case we
put d.f. on the table and referred to that cell (C42).
The Pvalue for a given Chi2 observed is obtained with the
Chidist function. The Pvalue can also be obtained through EXCEL's
Chitest function, which requires a table of observed values and expected
values.
An important crosscheck is that EXCEL's Chitest give the same result
as the Chidist function on the Chi2 value calculated by a different
route. If these aren't exactly the same, something is wrong.
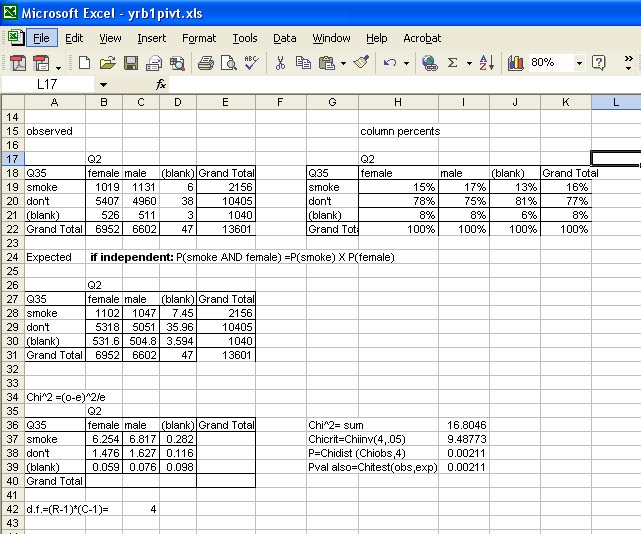
Here are the numeric results of the flexible formulas, showing that males are more likely to smoke than females and the results are highly significant, so probably reflect real differences in the populations represented by this survey. If there is really no difference (Ho is true) then the probability of obtaining this result is about 2 in a thousand. We can therefore conclude with about 99.8% confidence that male highschool students are more likely to be smokers than are female highschool students.
| In some cases, you will want to calculate percents of row totals rather than column totals. In that case the flexible formula would be B19/$E19 |
Once this spreadsheet is assembled, it has been designed to be flexible
and apply to other crosstabulations. A table with different dimensions
can be accommodated by inserting or deleting rows or columns.
make sure to insert or delete on the inside of the table rather than
the periphery so that range references are not disrupted. after inserting
rows or columns to fit the new dimension simply copy the formulas down
or across to fill the new space. Change the degrees of freedom to fit the
new dimensions (R-1)X(C-1), and all the formulas should adjust to give
the correct results.
| be sure to change degrees of freedom to fit the new dimensions of the data. | To calculate percents of row totals rather than column totals, the flexible formula would be B19/$E19 |
Calculate totals for rows and columns of the observed values. Set up tables next to the observed table and next to the calculated expected frequency table in which you calculate the percents of counts related to total count for each Row. Note this will require slightly different formulas than those shown in the figure, above. But, in this case the interesting result is percent of pot users who are depressed. I think this will clarify what we are doing in the test and help in the practical interpretation. Calculate Chi² , Critical Chi² and Pvalue for the observed result. If you use a sheet designed with flexible formulas for copying as we did in class this will be about a 5-minute job. Use 5% alpha to test independence of amount of Marijuana smoking and sadness. Compare the EXCEL Chitest result to the Chidist result for the calculated observed Chi² value (if these aren't the same then there is something wrong. Fix it.).
